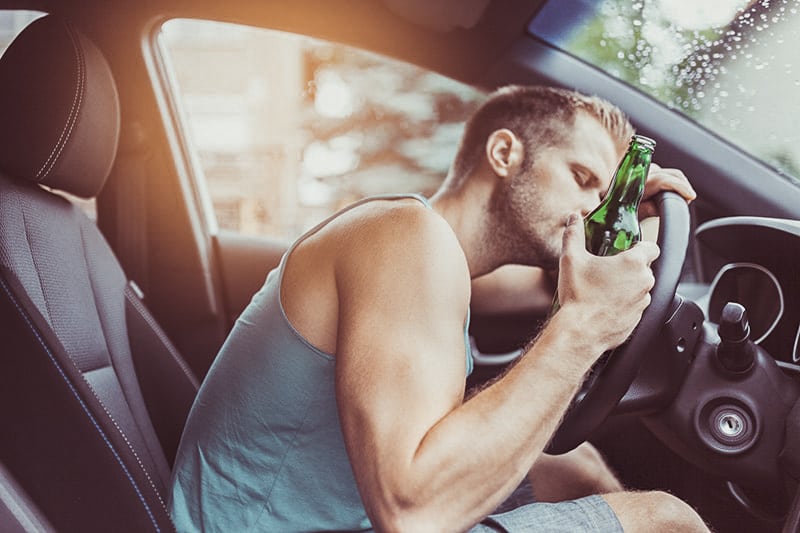
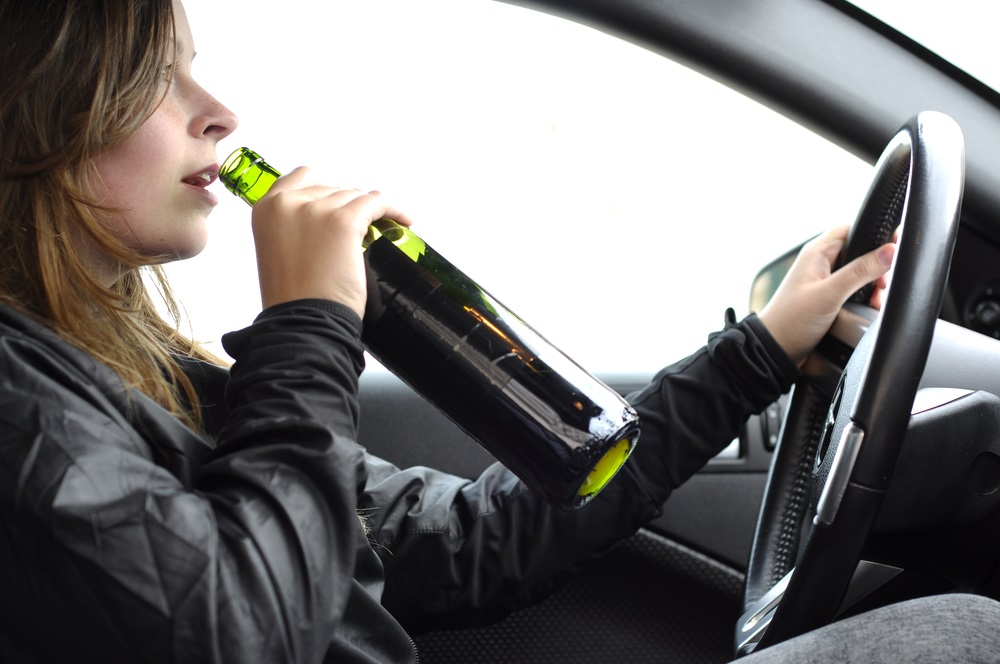
The timespan between Memorial Day and Labor Day is designated as the “100 deadliest days,” considering the uptick of fatalities on the roadways and waterways due to drunk operation of vehicles and boats.
Statistics released in April of 2023 from the “National Highway Traffic Safety Administration” indicate fatalities related to drunk driving increased by 14 percent between 2020 and 2021. It’s suggested that alcohol use and abuse have increased since the pandemic and are continuing now that people are able to re-enter the social scene despite the associated risks.
In much of the country, the legal BAC limit is set at “0.08 g/dL or grams per deciliter,” with the only exception being Utah which is “0.05 g/dL” for driving after drinking. While these are the legal limits, impairment begins at levels lower than these. Read here for details on how alcohol affects driving with ranging BACs.
Police arrest roughly a million people over the legal BAC levels in the US annually. Still, the indication is this only accounts for a minimal portion of the number of impaired motorists. Let’s examine the statistics more in-depth.
Table of Contents
ToggleDrinking and Driving Statistics

Drinking and driving is a rising problem in the US. There are groups focused on raising awareness, attorneys concentrating their practice on defending motorists guilty of driving under the influence, and each of us likely knowing someone involved in an accident due to someone having too much to drink.
Impaired driving is a number one safety issue on the roadways, with 2021 seeing the most fatalities since 2006 at 13,384 related to driving drunk, meaning their BAC was at or above 0.08 g/dL. This equates to 31 percent, which is critical, but the indication is this shows progression considering the astounding rate in 1982 at 48 percent.
The many programs made available to the population, the high visibility of law enforcement, and the laws restricting the drinking age contribute to the decrease. The National Highway Traffic
Safety Administration projects that roughly 30,000 lives have been saved based on the minimum drinking age between “1975 and 2017 – more current estimates are unavailable.”
The prevalence of fatal crashes resulting from alcohol impairment ranges falls into a varied age group as follows:
25 – 34 years old , 27 percent
45 – 54 years old , 20 percent
75 and older , 10 percent
10 Drunk Driving Statistics To Know
- Fatalies with BAC below the legal limit
Approximately 16 percent of motorists involved in fatal accidents fall below a BAC of 0.08 g/dL. Roughly half of the fatalities in motor accidents range at over 0.16 g/dL BAC or higher. The peak is around 1.17 g/dL. A majority of crashes happen when the elements are good, and about half occur on urban roadways, with over half happening at night.
- Months when drunk driving is prevalent
When looking at 2021, which seems to be some of the most current statistics available, the majority of drunk-driving accidents happened in July and October, each at around 10 percent, with January rounding out at 6 percent.
- Males make up the majority of DUIs
Out of the roughly one million people arrested in 2017 for DUI, a majority of these drivers were male – US Department of Transportation 2020
- MADD statistics
Drunk Driving costs roughly $100 billion annually for the whole of the US – MADD 2017
- DUI is among the most prominent cause of motorist fatalities
Over 30 percent of fatalities annually are related to driving under the influence – National Institute on Alcohol Abuse and Alcoholism, 2017
- Women less likely to be involved in a fatal car crash
Women will be half as likely to be drunk while driving or be the victim of a fatal car crash than men – Center for Disease Control and Prevention 2016
- Under-age fatalities are gradually declining
Every 48 minutes, one individual dies from an impaired accident, or 30 people each day in America, and 800 are injured. There has been a decline in under-age fatalities due to drunk driving by almost 30 percent in the last ten years – NHTSA 2017
- Still, drivers 16+ are consuming liquor and getting behind the wheel
People ranging in age from 16+ in 2017, equating to over 20 million drivers consuming liquor – Substance Abuse and Mental Health Services Administration 2017
- Vehicles involved in drunk driving
In the year 2019, large truck operators – 2.0 percent, light truck drivers – 18.9 percent, auto motorists – 20.4 percent, and motorcyclists – 28.7 percent drove with BAC levels at 0.08 percent or higher, legally intoxicated, and were involved in fatal crashes – FMCSA 2021
- Random Breath Alcohol Concentration testing
From 2013 to 2014, a national roadside driver survey was conducted to randomly test the BrAC (breath alcohol concentration) of select drivers. From this survey, 1.5 percent were at or above 0.08 percent BAC, legally intoxicated compared to a 1973 survey in which 7.5 percent were found drunk – IIHS 2021
In Which States Is Drunk Driving More Common?
While New York didn’t clarify drunk driving, it was the first state, in 1910, to create a law prohibiting driving under the influence. By the 1970s, the federal government and the remaining states joined the effort by incorporating laws criminalizing the behavior.
Between 2020 and 2021 (the most recent data available), a significant increase was noted in drivers with 0.08 BAC in crashes. Still, several states rose in incidents. Alaska had a 100 percent increase.
Following with 50 percent increases were Delaware, Massachusetts, Idaho, and the District of Columbia. The states that had a decline included West Virginia, Maine, Nebraska, and Rhode Island. Many of the large states didn’t contribute to the FBI reports. An astounding 25 percent of arrests made in Pennsylvania were related to intoxication or being drunk behind the wheel.
This was at 17.4 percent in Washington and ranged at 15 percent for Wyoming, Minnesota, Idaho, Montana, Maine, Alaska, Vermont, and North Dakota. The remainder of the states were between 13 and 5 percent, with Alabama and Delaware coming in at roughly 1 percent.
Conclusion
Even one life claimed by drunk driving is too many. The numbers were declining, but it’s starting to go back up. The number of free driving services made available when there are special events leaves no excuse why anyone should need to get behind the wheel and put anyone’s life at risk, including their own.
If you know you’re going out and will be drinking, take a cab, call an Uber or rideshare with a designated driver, and be responsible instead of turning into a statistic.

I am a passionate beer connoisseur with a deep appreciation for the art and science of brewing. With years of experience tasting and evaluating various beers, I love to share my opinions and insights with others and I am always eager to engage in lively discussions about my favorite beverage.


